jtrace - augmented, Linux/Android aware strace with plugin architecture
The jtrace tool is another one of my tools that started in order to address a shortcoming - in this case, the lack of strace(1) for ARM64. This was (somewhat) rectified with Google's finally providing one in their emulator image (which they finally produced as part of M), but the implementation is still buggy and falls short of the true power of system call tracing. So I decided to write my own. As in other cases, the tool evolved and actually became useful by its own right, so I'm releasing it. (I also feel bad about forgetting to give my Androidevotee followers a present like the one I gave the Applytes)
This tool is provided as one of the free downloads provided for the "Android Internals" book (http://NewAndroidBook.com/). You are welcome to use it even if you don't buy the book (though naturally you're even more welcome to buy the book :-). I used it extensively in my research, and provide plenty of use cases as experiments and examples in Volume II (especially for dealing with Binder).
The tool's latest stable version, as a tar file with binaries - presently ARM64 and x86_64 , can always be obtained at this page right here. If you want my "nightly" build (a much more frequently updated, albeit potentially less stable build) it's here. An older version did support ARM32, but it doesn't make sense to support it anymore.
jtrace offers several significant advantages over strace(1):
- Android-awareness: Not just dumping system calls, but actually deciphering some socket based I/O, including
- System Property settings (for PID 1,
/init) - see examples, below - Input events (for InputReader) - see examples, below
- Binder message parsing (auto detected). For some processes (notably,
ActivityManager) it will actually decipher the parcels as well! And more will be added with plugins (this is presently unstable) - .. And I'm working on intents and InputDispatcher, so expect these soon
- System Property settings (for PID 1,
- Colorized output: Actually very useful considering the copious output involved
- Thread name capabilities: Android uses
prctl(2)to name threads (especially insystem_server). You can attach directly to a target thread by specifying its name. - Plugins: Enabling anyone to interface with the tool by providing their own shared object, which
jtracewill be happy to load, and call back. - Fault injection: (beta): Allowing you to intercept and actually block certain system calls, or alter their arguments/return value - Still working on this one and not ready for mass consumption
- Automatically tags descriptors returned from
socket(2)/open[at](2)/etc. so you can find them in copious output
For updates, you might want to check out the RSS feed, or follow my company's feed, @Technologeeks, which (aside from the occasional OS X/iOS related stuff) tweets about updates to this and other tools.
Examples
jtrace is designed to be as compatible with strace(1) as possible.
If you're not too familiar with strace(1), you ought to be - no native level developer, on any Linux or Android - can afford to remain unaware of this amazingly powerful piece of work. I myself owe a fair deal of my knowledge to countless hours spent using this tool to trace all sorts of binaries to figure out how things really work, without reading any source code (which often didn't exist openly).
As is usual, running it with no arguments will produce a usage message.
flame:/ $ /data/local/tmp/jtrace64
Usage: /data/local/tmp/jtrace64 [arguments] -p ....
             or
       /data/local/tmp/jtrace64 [arguments] /path/to/executable

strace(1) compatible options:
   -f       :  follow forks (or attach to all threads)
   -i:         print instruction pointer at time of syscall
   -o _file_:  output to _file_ (if relative path, will be put in /data/local/tmp)
   -p _pid_/name:   specify PID to trace. May also be a thread, or a process name
   -q:  suppress syscalls without handlers (but warn)	 -qq: suppress and don't warn
   -t:   absolute timestamp	 -tt: with usecs
   -T:		print time spent in each syscall
   -v: verbose mode   -y: print paths associated with file descriptor arguments
    --maxlen _len_: Truncate buffers/strings printed at _len


jtrace specific (that is, not found in strace)
   -O:          Output to automatic filename (/data/local/tmp/(jtrace.out)
   --color:    (because life is better with color!)
               Can also export/setenv JCOLOR=1 to make default
   --thread _name_: Attach to a process or thread with specific _name_
   --service _name_: restart service _name_ and auto attach to it (via init)
   --np:       Do not load any plugins, even if detected
   --plugin:   Load a plugin (from $JTRACE_EXT_PATH). If not specified, all plugins load.
   --tests:    Run internal test suite. J uses this. If this should fail for you, let him know

Interactive keys: (Use when traced process is running)
-----------------
 M - insert Mark in output
 F/T - Freeze/Thaw process (not yet!)

----------------------------------------------------------------------


This is jtrace (64-bit) compiled on Aug 25 2021 17:37:23
jtrace shares no code with strace, or any other open source.
Latest version always available for free at http://NewAndroidBook.com/tools/jtrace.html
Please visit http://NewAndroidBook.com/tools/counter?jtrace so I know you're using it :-)
Tracing property operations
All property set operations have to go through init - so to get those, just attach to it!
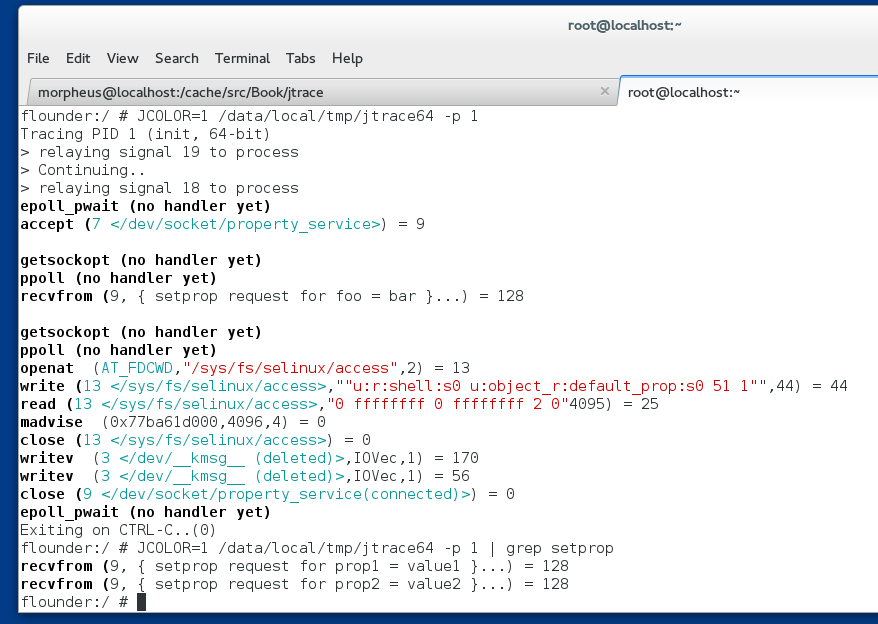
As you can see above, jtrace will show you the full operation involved - from getting the socket request, through checking SELinux, and the setting of the properties. But grep(1) is your friend if you just want to get the properties being set.
(you won't be able to trace property get operations - not due to a jtrace limitation, but because these are performed in-memory and do not involve syscalls)
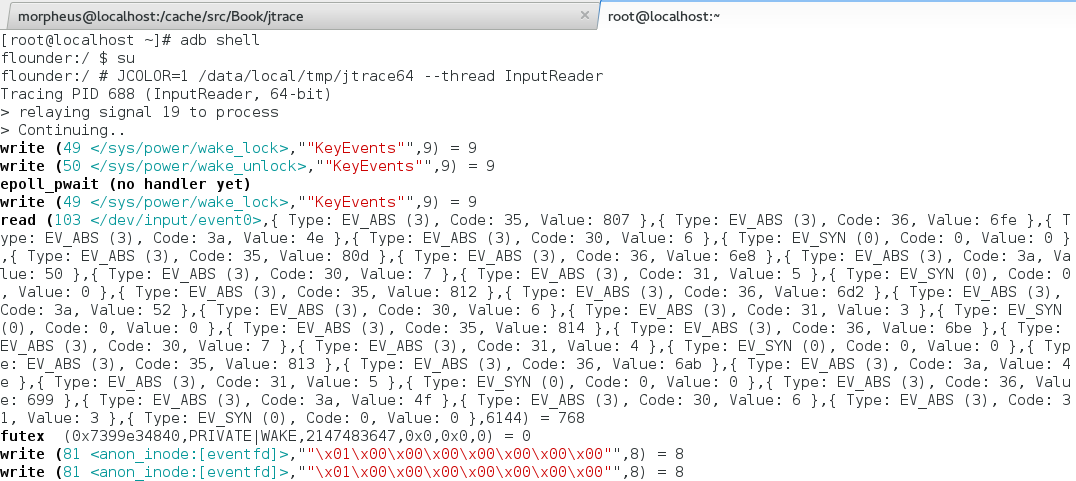
Tracing input
Using --thread you can attach to system_server's InputReader thread (without needing to dig up its PID), and jtrace will be smart enough to figure when input events are involved, and decode them for you!
Tracing BINDER!
Binder, only the most critical and least comprehensible IPC/RPC mechanism in Android, is slowly yielding before jtrace! New version A) doesn't crash on it and B) already supports quite a few interfaces! You can isolate Binder messages by grep Method:
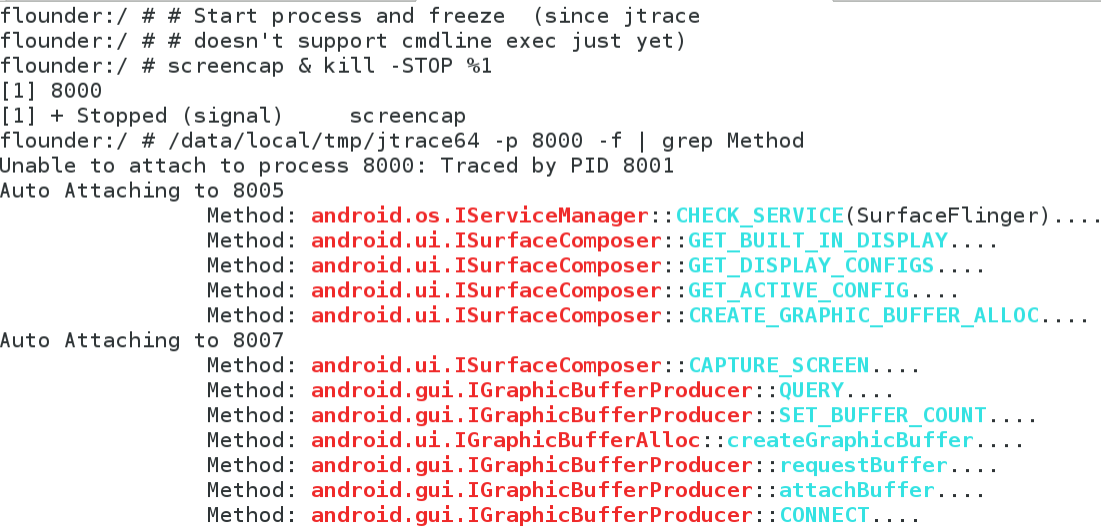
Note the use of -f to auto-attach to threads - since Binder spawns a thread pool (might crash in rare cases, I got that bug). I'm also working on deep message tracing (i.e. with arguments, like it does for servicemanager). If AIDL finally does cpp, this will make my life easier. Expect more soon.
12/14/2016
- Jtrace for ARM 32
- Jtrace for Android x86!
- Jtrace for Linux!
- SDK for plugins - so you can interface with jtrace and write your own hooks! IMHO, this can be huge and open up a world of third party plugins! The API is designed to be as architecture agnostic as possible, wherein you provide a shared object (.so) that calls on
jtrace's engine, without worrying about registers and memory APIs - you just call on a standardized, argument-centric API I've provided:
6/23/2021 - a MUCH simpler API
//
// Public API of jtrace for third parties
//
// License: Absolutely free for NON-COMMERCIAL use.
//
// If you want to use this commercially, Please talk to me.
//
// You might want to consider reading my books, or going
// to a training at www.technologeeks.com, where we teach
// this stuff and lots more.
//
//
#include <sys/types.h>
#include <sys/socket.h>

#ifndef JTRACE_API_H
#define JTRACE_API_H

//
// New, far simpler API:
//
// No more regs! Registers are stashed in thread local storage and entirely abstracted by getRegValue(#)
// so you don't need to concern yourself with arch differences. Also, is_32() gets bitness from TLS as well,
// so getRegValue needs just one argument - the register number!
//


int ignoreAllSyscalls(void);


uint32_t hexDumpToBuffer (char *OutputBuf, int OutputLen, char *Buffer, int Len, uint64_t Address, int Indent);

#ifndef _32
typedef unsigned long uint64_t;
#endif

#ifdef _32
#define arch_int uint32_t
#else

#define arch_int uint64_t
#endif


//
// Abstracting the calling convention:
//
// JTrace will automatically translate these register "numbers" into the corresponding
// registers of the underlying architecture, as per the ABI. In the ARM64 case, these
// are straightforward noops - ARG_0...ARG_7 are X0..X7. In ARM32, X0..X3 are 0..3,
// but jtrace is smart enough to get the other "register" values from the stack. In the
// Intel case, the mapping is between rdi/rsi/rdx/rcx/r8/r9 or the stack.
//
// Likewise, the syscall number - in Intel, that's eax/rax. In ARM32/ARM64 r7/r8 respectively
//
// This enables you to get the arguments in a plugin without bothering to consider how the
// calling convention works!

#define REG_ARG_0	0
#define REG_ARG_1	1
#define REG_ARG_2	2
#define REG_ARG_3	3
#define REG_ARG_4	4 // ARM32: stack
#define REG_ARG_5	5
#define REG_ARG_6	6 // Probably won't need more than this since syscalls have max 6..
#define REG_ARG_7	7

// these are intentionally values greater than ARM64's registers,
// so we are guaranteed to map them by ABI
#define REG_ARG_RETVAL		33
#define REG_ARG_SYSCALL_NUM	34

// The actual register representation is the per architecture pt_regs,
// but that's made opaque by this here struct
typedef struct jtregs regs_t;

// the opaque structure will be provided for you (by reference) when jtrace
// calls your callback handler, which needs to be implemented as:

typedef enum {
	DO_NOTHING = 0, // You want JTrace to continue as normal
	BLOCK 	   = 1, // You want JTrace to block this system call
	NOT_HANDLED = 2, // You didn't handle the syscall
} syscall_handler_ret_t;

typedef syscall_handler_ret_t (*syscall_handler_func) (int exit, int pid);

enum syscallHandlerFlags {

	HANDLER_ENTRY_ONLY = 1,
	HANDLER_EXIT_ONLY  = 2,
	HANDLER_OVERRIDE_DEFAULT = 1024,
};

// piece de resistance
int registerSyscallHandler (char *SyscallName, // must exist or you'll get -1
	     syscall_handler_func Handler,     // Your callback, per above
		              int Bitness,     // 32, 64 or 0 (both)
			      int Flags);      // as per flags, above

#define ERR_SYSCALL_NOT_FOUND	(-1)

// The idea is to then leave the regs_t opaque, and use the accessor:
// And to ensure that's the case, JTrace no longer exports regs.
long getRegValue (int num);

// setRegValue - calls GETREGS, changes your value, then calls SETREGS

void setRegValue (int num, uint64_t value);


// Stash register values between calls.
// Use this primarily for REG_ARG_0, which will be often destroyed
// on syscall exit. Note the saved registers are also on TLS, but
// may be different from the "real" ones (i.e. getRegValue ! necessarily = getSavedRegValue)
//
void saveRegValue (uint32_t Reg) ;
uint64_t getSavedRegValue (uint32_t Reg);

// This conveniently hides process_vm_readv, /proc/pid/mem, or ptrace
int readProcessMemory (int Pid, arch_int Addr, int Size, char *MyAddr);

//--- 3/30/2017 ----

// And this can set the process memory, writing Size bytes from MyAddr to Addr!
int writeProcessMemory (int Pid, arch_int Addr, int Size, char *MyAddr);

// Get an FD name. This is useful for operating in read/write hooks only
// if the fd is connected to a certain file
char *getFDName(int fd);


//--- 3/26/2018 One year later --

typedef int binderHook_t (char *Parcel , size_t Size, int Code);

int registerBinderIoctlHook(char *interface, // UTF-8 or UTF-16 OK
			    binderHook_t	Hook);


// -- 3/07/2020 Two years further: Back to Android Internals, full steam!

// Returns jtrace verbosity level, as per user specified "-v" arguments.
// You can use this to have your plugin print more (or less) information accordingly
int getVerbosityLevel ();

char *getIOVecDataFromMsgHdr (struct msghdr *MsgHdr,
			      unsigned int *BytesRead,
			      pid_t    Pid);

char *getOutputBuffer ();
void updateOutputBufferPos(int byHowMuch);

// Resolve name (from cmdline) for a given PID.
// hides /proc//cmdline, and possible caching
char *getProcNameForPid (pid_t pid);

// Is JTrace's current config colorful?

int config_color() ;
int config_debug() ;
//--------------------------------------------------------------------

// Other APIs I use for testing
//-----------------------------

// Get a system call number by providing its name. This is especially useful
// for testing, because God only knows why the numbers keep changing across
// various platforms.

int getSyscallNum (char *);


// For testing
void dumpArgumentsForSyscall (char *);
void dumpAllSyscalls(int);


int get_is32(void);
#endif
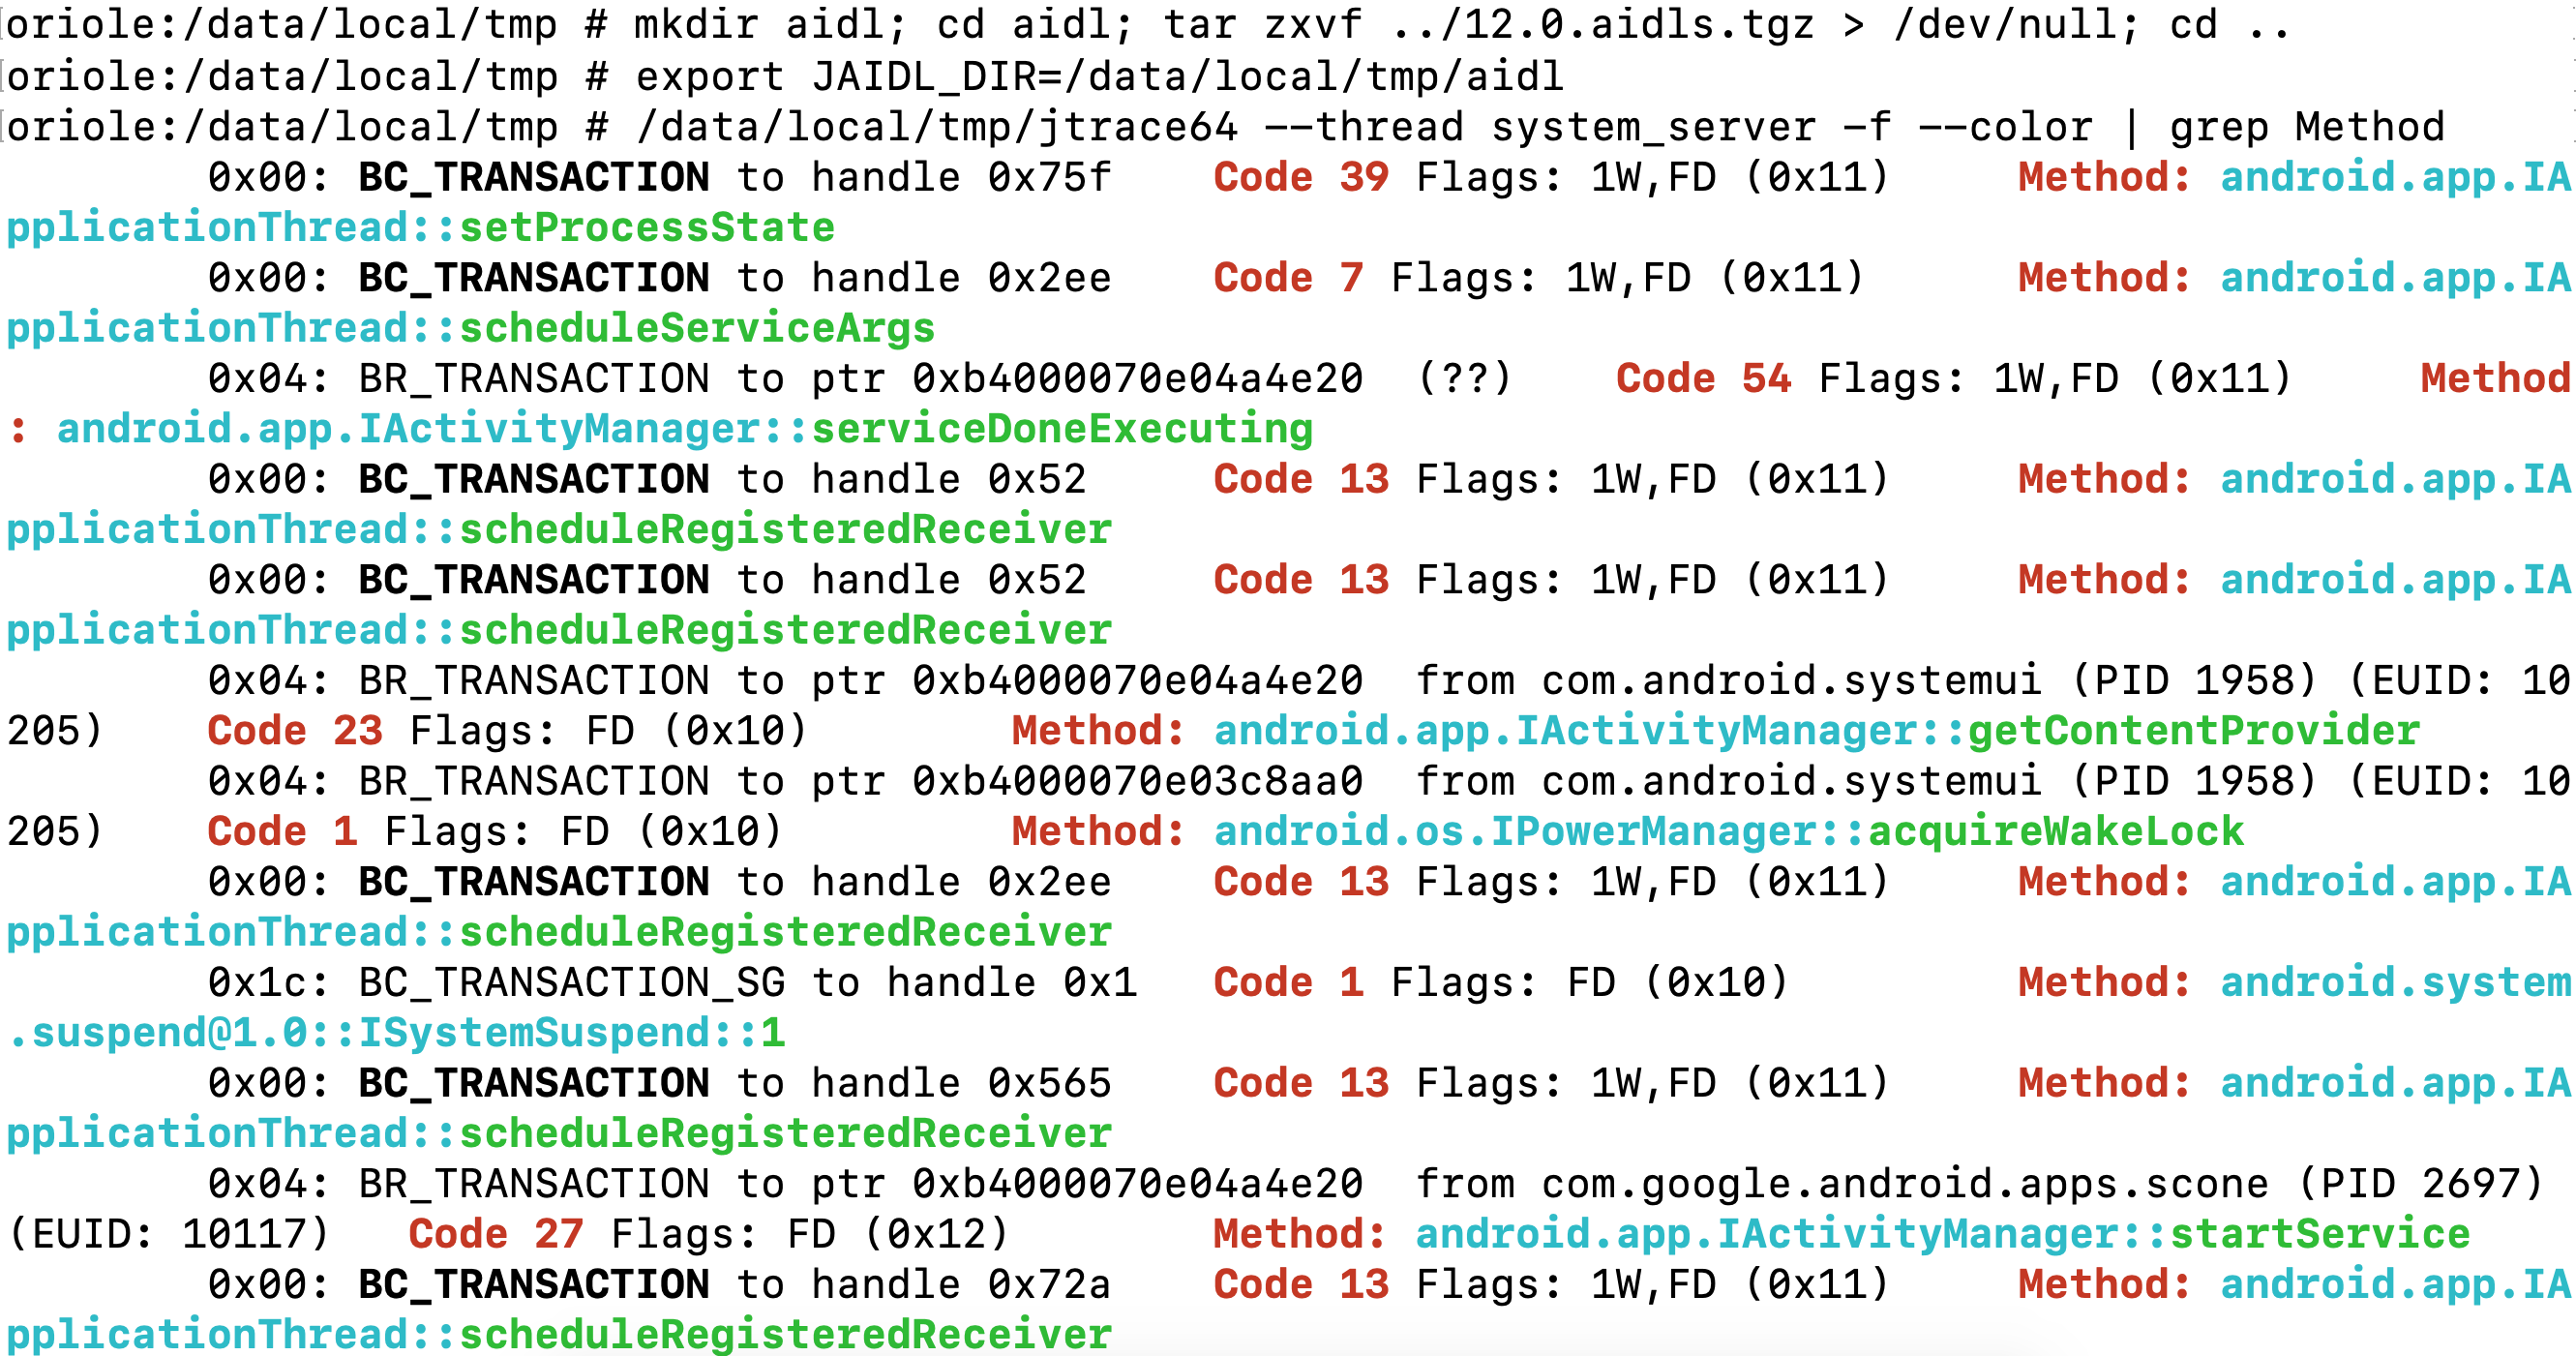
12/05/2021 - AIDL awareness
jtrace64 (the Android version) is now compiled with AIDLwise - a small library capable of parsing AIDL files - so if you drop AIDLs in JAIDL_DIR it will automatically look foor them whenever tracing binder. The jtrace.tgz download now comes bundled with "12.0.aidls.tgz" - just unpack them, set the dir, and start tracing:
Example Plugin Usage
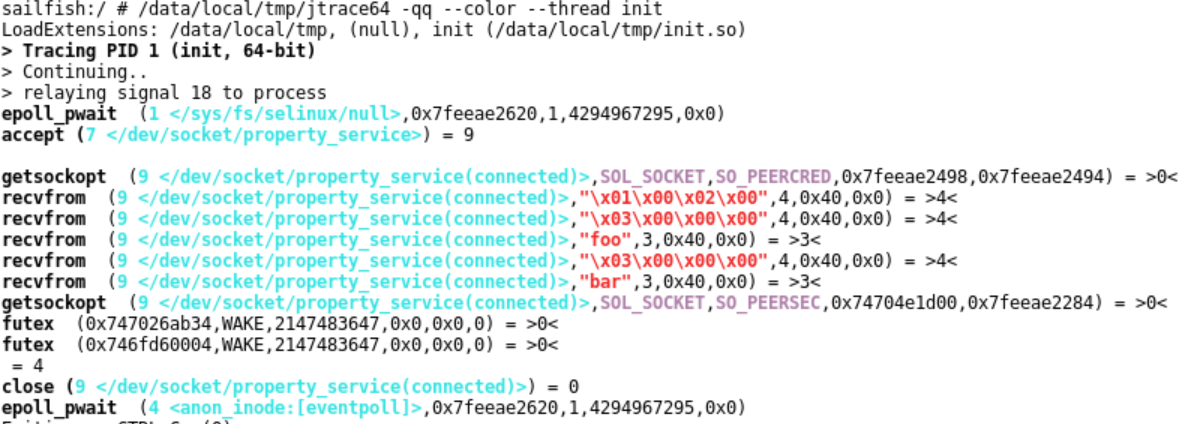
JTrace now auto-loads plugins. Drop your plugin into the JTrace directory (specified by JTRACE_DIRJTRACE_EXT_PATH or in init's setprop feature. This has changed in Oreo to the setprop v2 format. Although jtrace innately supports v1, without a plugin v2 would look like this:
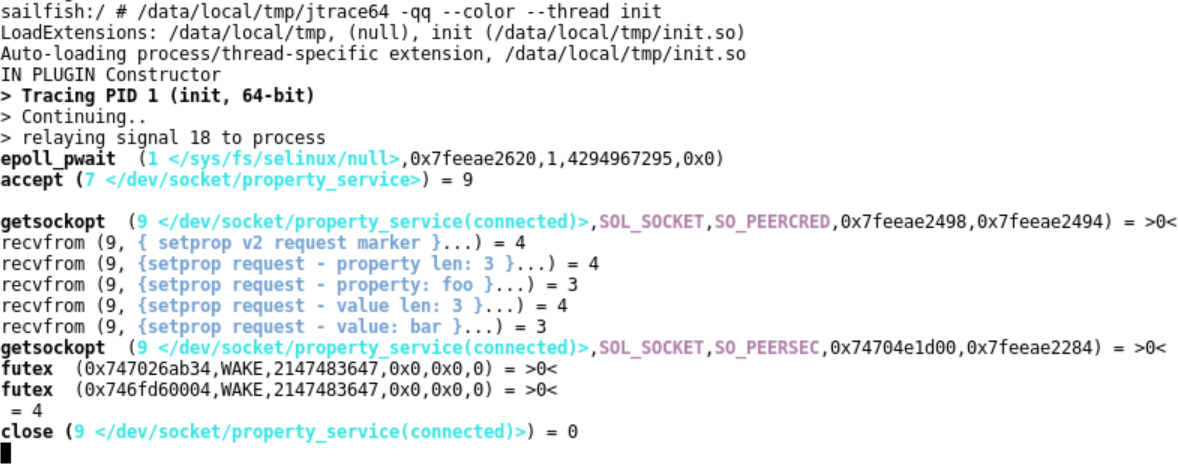
But with the plugin, it looks soooo much better:
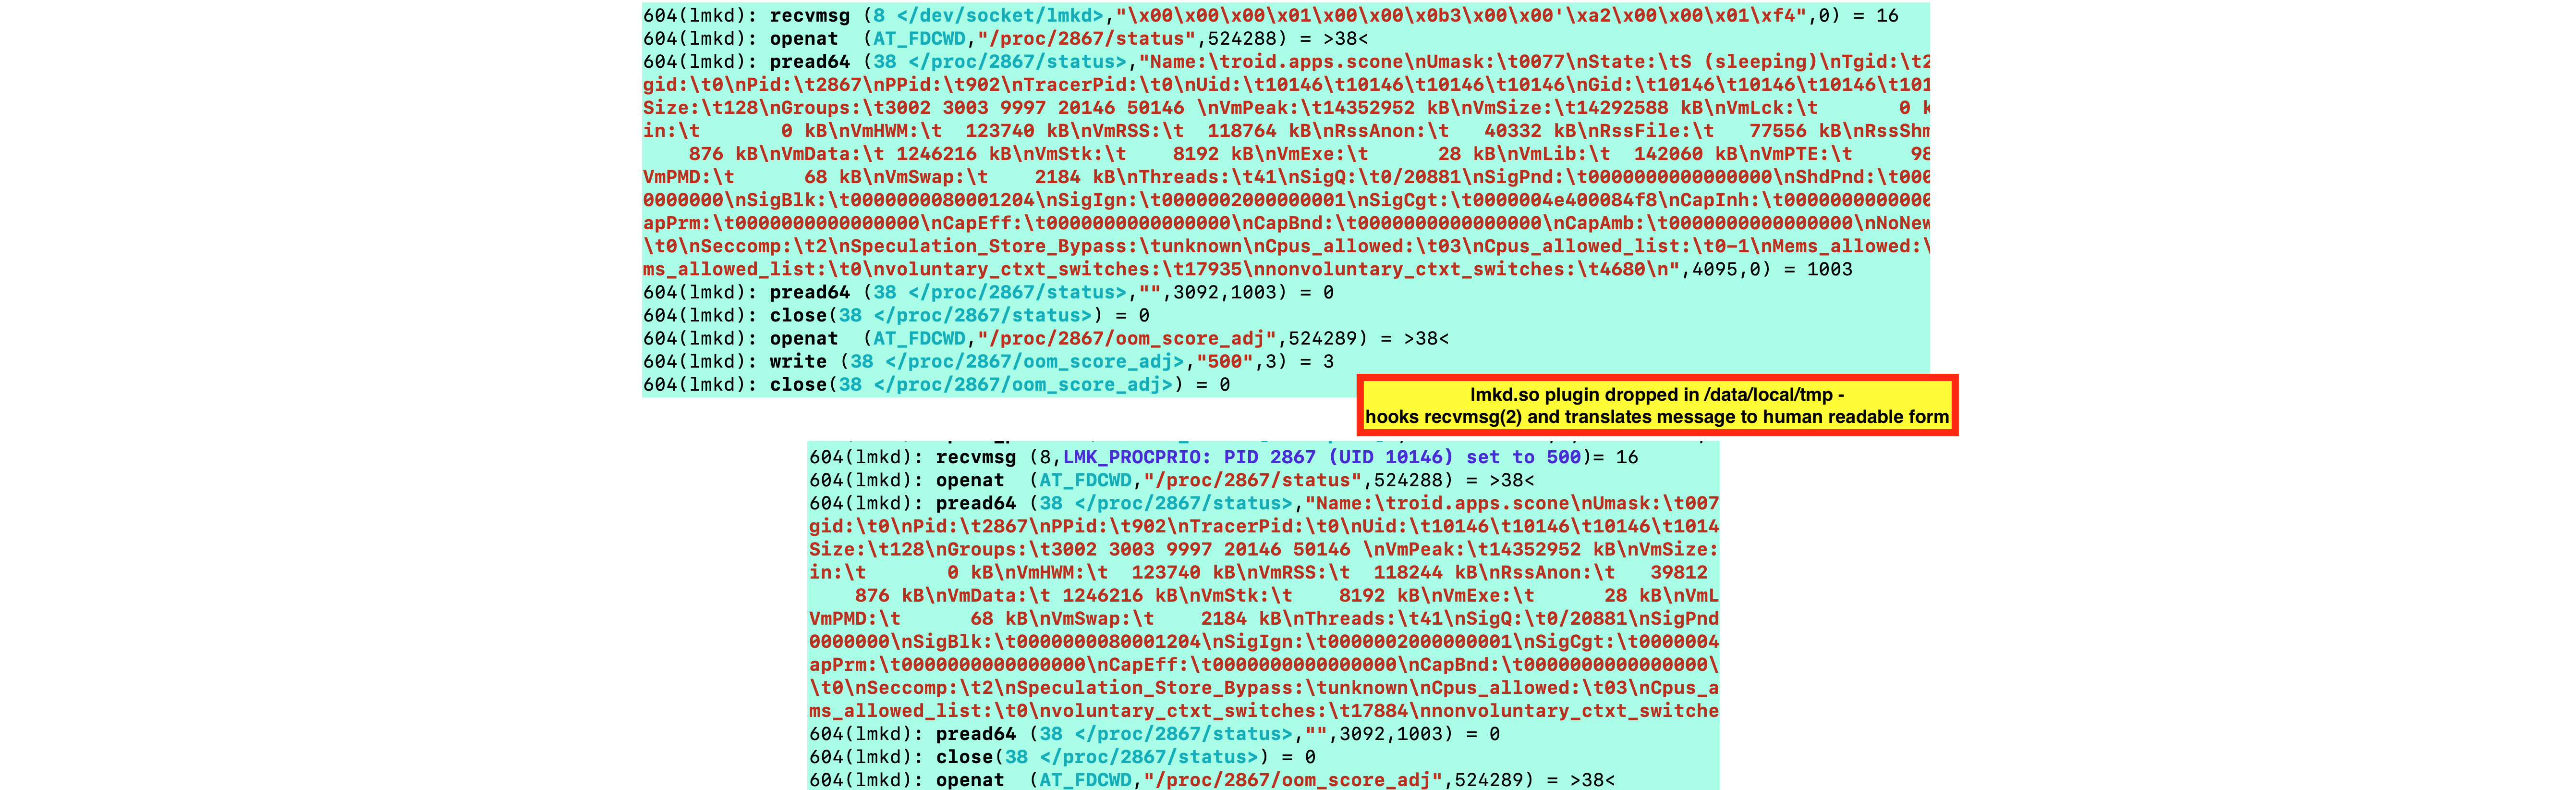
Another example, for lmkd:
Get the source of the sample plugin for /dev/kgsl-3dd0
Get the source of the sample plugin for /dev/socket/lmkd
Get the jtraceAPI.h (latest)